Bitcoin price continued to range sideways in the $9k range throughout the month following a brief spike to $10,100 on June 1.
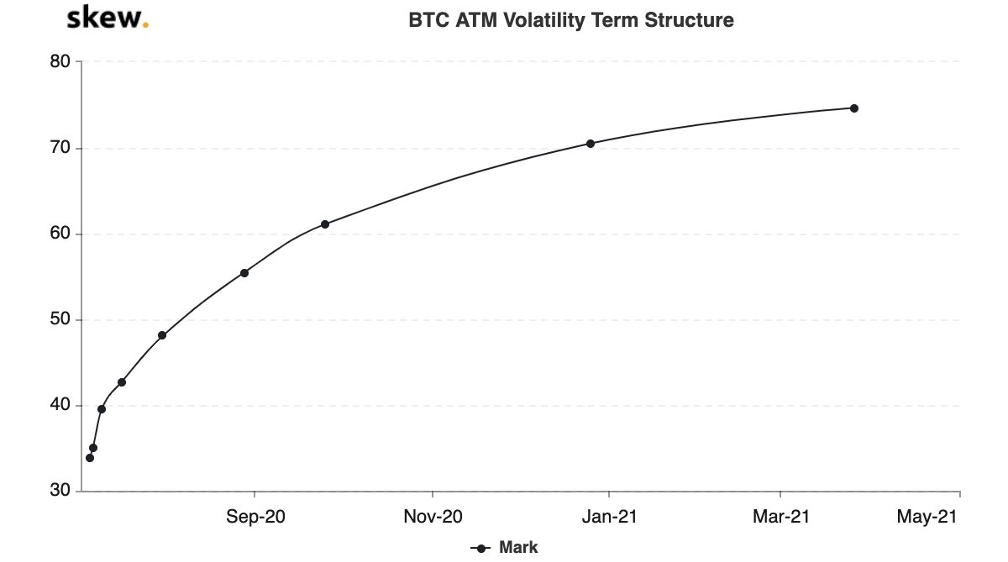
According to data from skew (a UK-based cryptocurrency analytics and trade execution company) the current 10-day realized volatility for $BTC sits at a historically very low 20%. The last time Bitcoin reached this 20% level was November 2018 just prior to a 50% price drop from $6,500 to a low of around $3,200 at the beginning of December 2018 – the cryptocurrency’s lowest price prior to the 2017 bull run blow-off top. Bitcoin’s implied volatility term structure is historically steep suggesting that the options market at least doesn’t expect much action in the short term.

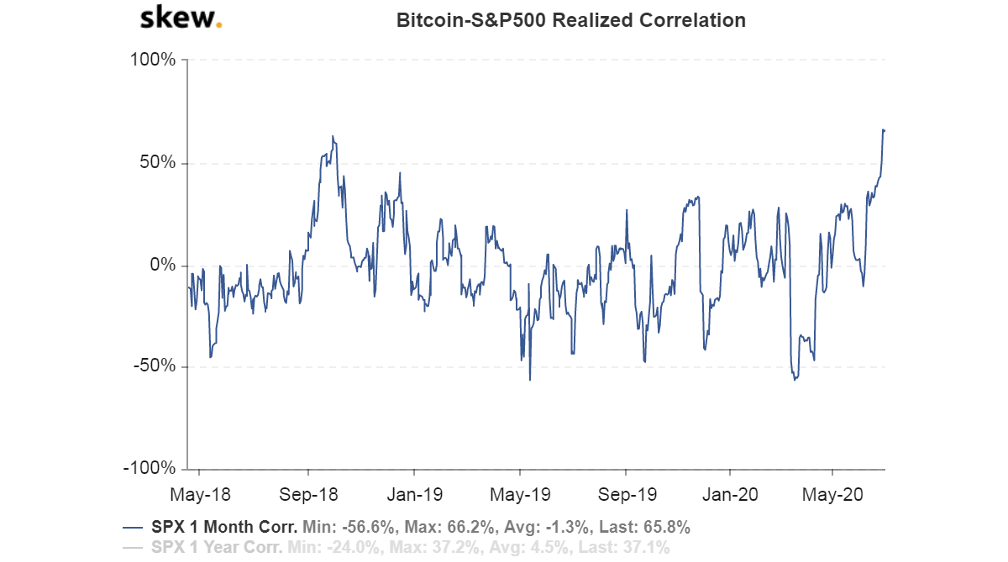
Meanwhile, the one-month bitcoin-S&P 500 realized correlation rose to a record high of 66.2% on June 30.
I agree with a recent Coindesk report: https://www.coindesk.com/bitcoins-price-correlation-with-sp-500-hits-record-highs
“While bitcoin and S&P 500 correlation is always a very good indicator of market movement, it never really maintains a consistent position. Bitcoin behaves more like a highly leveraged position and follows the market trends in a more volatile, dramatic up and down swings,” said Wayne Chen, CEO and director of Interlapse Technologies, a fintech firm.
The one-month metric oscillated largely in the range of -30% to 50% for 12 months before rising to record highs above 60% on June 30. The data indeed shows that bitcoin’s correlation with the S&P 500 is somewhat inconsistent.
The one-year correlation has also risen to lifetime highs above 37%, according to Skew. One should note, though, that readings between 30% to 50% imply a relatively weak correlation between variables.
“Bitcoin, by all accounts, is still a risk asset. Despite those who may tout its fundamental similarities to gold, it has not yet proven to be a sufficient hedge or a flight to safety in times of risk-off sentiment,” said Matthew Dibb, co-founder of Stack, a provider of cryptocurrency trackers and index funds.
Bitcoin has more or less behaved like a risk asset this year. The cryptocurrency’s price fell from $10,000 to $3,867 in the first half of March, as global equities cratered on coronavirus fears. It then rose back toward $10,000 in the following two months as the S&P 500 saw its fastest bear market recovery on record.
However, being treated as a risk asset may be a blessing in disguise for bitcoin.
“Given that the correlation between BTC and equities is still so high, our expectation is that this is only bullish for bitcoin price in the short term, as global markets benefit from an unprecedented amount of monetary stimulus,” said Dibb.
Indeed, the U.S. Federal Reserve (Fed) and other major central banks are injecting massive amounts of fiat liquidity into their respective economies to counter the COVID-19 slowdown. As of last week, Fed’s balance sheet size was $7.01 trillion – up 67% from $4.24 trillion in early March, according to data provided by the St. Louis Federal Reserve.
BITCOIN’S NEXT MOVE
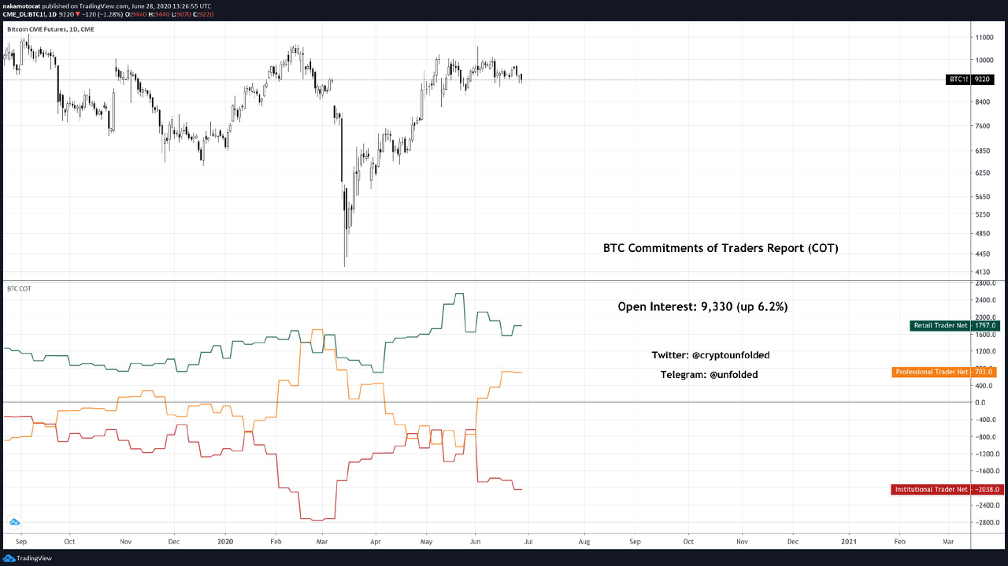
My bias for bitcoin’s next move continues to be toward the downside, a view that seems to be consistent with other institutional traders based on bitcoin $BTC futures data from the Chicago Mercantile Exchange.
The CME releases a CoT report each week which shows position data held by retail, professional, and institutional traders of Bitcoin.
The latest CoT report shows institutional traders, which include money managers and hedge funds, are net short with an aggregate position of -2,038 BTC.
This contradicts sentiment held by retail and professional traders, who are both net long.
At present, retail traders remain somewhat flat with an aggregate position of +1,797 BTC, making up the bulk of the activity on CME Bitcoin Futures.
According to my own proprietary technical analysis I see a possibility for a major surprise to the downside from today through mid-August with a $BTC price target of $1,800 and recommend positioning long bids accordingly. Such a move would require a black swan that leaves no asset class unscathed at the moment of impact. Is anything on the horizon and specifically relevant for bitcoin?
Three Gorges Dam Black Swan
June 23, 2020 - Flood alert at Three Gorges Dam
China faces its worst floods in 70 years after weeks of heavy rain; disasters have been declared in 24 areas, including the upper reaches of the Yangtze; 7,300 homes have collapsed and damage exceeds 20.7 billion yuan
Source: https://www.asiatimesfinancial.com/flood-alert-at-three-gorges-dam
Three Gorges Dam Scrutinized for Structural Flaws as China is Ravaged by Flooding By Victoria Sinla Jul 04, 2020 08:10 AM EDT
Source https://www.natureworldnews.com/articles/44025/20200704/three-gorges-dam-structural-flaws-china.htm
The controversial Three Gorges Dam in China, the biggest project for hydroelectric power not only in the country but also in the whole world, has been scrutinized for issues on environmental damage and structural flaws from the very first time it was proposed for construction around the 1950s.
Currently, with torrential rainstorms ravaging half the country, an expert in hydrology is warning of a collapse due to increased water pressure, which will endanger the millions of people living in nearby areas.
Since early June of this year, widespread heavy rainfall and flooding have devastated 11.2 million citizens living in 26 municipalities and provinces in southern and central China. Over 9,300 homes have been destroyed, and 171,000 more have been damaged. According to the local authorities, the financial toll has already reached beyond 3.4 billion dollars or 24.1 billion yuan.
This devastating rainfall is expected to rage for ten more days. The mountainous province of Guizhou in southwest China already experienced a 16-foot higher rain or stormwater beyond the acceptable threshold. Meanwhile, in Yanhe County, severe flooding has already caused cascading waters. To flow over a bridge, washing away the houses beneath it.
The dam's structural integrity is also in danger of breaking. Wang urges those living nearby to have emergency kits ready for protection. Sichuan Province resident Mr. Chen is worried that a catastrophe will befall the country under the current mismanagement of the regime. He said the government considers the dam a show project, and its disastrous consequences will have commoners footing the bill.
Why is this significant? The majority of computing power contributing to the operation of the Bitcoin network happens to be located in harm’s way should the Three Gorges Dam collapse.
In January I focused on China and this year being the “Revenge of the Rat”. After the ravages of COVID-19 still plaguing the globe, could a natural disaster of unimaginable scale originating in China be next?
In terms of Bitcoin mining, which is the fundamental task of creating blocks to maintain the blockchain and receiving a reward for that service in bitcoins, China is home to the world’s largest bitcoin mines, thanks to cheap electricity and breakneck speed of getting things done. At one time the country accounted for 95% of the volume traded in global markets. China’s mining dominance in this aspect is over 60% from latest reports by both CoinShares and TokenInsight’s 2019 Annual Mining Report with some reports suggesting China has more than a 70% ownership in terms of bitcoin miners. If you want to use mining pool dominance (hash rates) as a proxy, current hash rate data shows that 9 out of the top 10 bitcoin mining pools are Chinese pools. (As of January 2020), these 9 pools control more than 80% of the total network hash rate which is at all-time highs of 112 EH/s.

The destruction of so much mining capacity would be massively disruptive and devastating to the price of bitcoin in the immediate short term, but also present an incredible buying opportunity as mining capacity in other parts of the world would capitalize on China’s misfortune and the network (along with price) would recover. In fact, North America is well prepared for such an opportunity…
See, e.g., Peter Thiel-backed Layer1 begins mining bitcoin at its West Texas facility
https://www.theblockcrypto.com/post/56337/peter-thiel-texas-bitcoin-mine-goes-live
Layer1 Technology, a Peter Thiel-backed bitcoin mining startup, has officially launched its operation in West Texas, four months after the firm announced its plans.
The San Francisco-based firm has brought online several mining containers, each has 2.5-megawatt (MW) capacity and deploys the liquid cooling technology to combat high temperatures in the region.
Although the firm declined to disclose the exact capacity of its current mining site, it expects to scale the mining facility up to 100 MW within the next few months, capturing more than 2% of the total Bitcoin network hashrate, per a statement shared with The Block.
Notably, Layer1 CEO Alexander Liegl said they hope to eventually encompass 30% of the total Bitcoin hashrate by the end of 2021 with the existing site and several others that they have acquired. This number, if realized, would overshadow the network hashrate shares of all Bitcoin mining pools, with the leading pools like F2Pool and Poolin currently providing around 18% of the total network hashpower, respectively.
Aiming at “repatriating U.S. Bitcoin mining,” Layer1 chose to locate its mining farm in Texas, in an attempt to counterbalance Chinese miners’ 65% control over the network. The firm also designed and manufactured its own mining equipment, instead of directly purchasing them from mining rig makers – most of which, such as Bitmain and MicroBT, are based in China as well.
According to Liegl, the firm will use 10nm computer chips from Korea-based Samsung Foundry for its equipment, but these will be “as performing as TSMC’s 7nm,” he said. In general, the smaller the computer chips are, the more can be packed onto the same chipboard, boosting the overall computing power.
However, Layer1’s custom mining equipment won’t be ready until mid-2020 and it is currently using third-party machines, according to Liegl.
Organic Selling Pressure Incoming
If the status quo should be maintained for a while longer, I consider that the posture of natural $BTC sellers and the distressed macro/geopolitical overall picture means a sell off to test March lows in the coming few months. Currently, Bitcoin miners seem to be hoarding $BTC – the five weeks Miner’s Rolling Inventory (MRI) dropped from 99.56%, to 94.88%. If this measure is below 100%, miners are keeping more of the BTC and expanding their inventory, while above 100% means they're spending more.

Source: ByteTree
MACRO SIGNS
For long term investors the case for increasing allocation to physical bitcoin (owning private keys, not mere price exposure through derivative contracts) and other cryptocurrencies strengthens daily in the current fog of systemic reset and structural collapse despite equity market recovery and USD relative strength in Q2. If we can avoid a black swan, markets may stay at an equilibrium for some time as infinite USD “liquidity” support by the Federal Reserve for the entire globe faces off against crashing fundamentals. At some point soon, it ends badly for the U.S. Dollar, all fiat currencies and paper assets.
Here are some of the signs…
GOLD & BANKS
Gold Rallies Above $1,800 to Cap Strong Quarter Prices ended the second quarter up 13%, their biggest quarterly advance since early in 2016
https://www.wsj.com/articles/gold-rallies-above-1-800-to-cap-strong-quarter-11593549228
Extreme COMEX Delivery Demand Continues - Craig Hemke (June 30, 2020) https://www.sprottmoney.com/Blog/extreme-comex-delivery-demand-continues-craig-hemke-june-30-2020.html
The Crisis Goes Up A Gear - Alasdair Macleod (June 18, 2020)
https://www.goldmoney.com/research/goldmoney-insights/the-crisis-goes-up-a-gear
Dollar-denominated financial markets appeared to suffer a dramatic change on or about the 23 March. This article examines the possibility that it marks the beginning of the end for the Fed’s dollar.

The early morning of Monday, 23 March was a significant time, marking the top of the dollar’s trade-weighted index. At the same time, gold, silver and copper prices, having fallen in the weeks before turned sharply higher. And while oil initially followed, it was a month before it resumed its uptrend — delayed by the delivery hiatus in the futures markets which briefly drove the price negative. The S&P 500 rallied the following day, ending a near 30% decline before recovering all of it, and then some.
Something had changed. Either markets decided that economic growth, both in the US and the rest of the world was going to continue following lockdowns, and growing demand for key commodities was going to be resumed. Or, as the decline in the dollar’s TWI indicated, the purchasing power of the dollar was going to decline, and commodity prices were reflecting an accelerating downtrend for the dollar’s purchasing power.
The performance of the S&P 500 since 23 March, being unhinged from any business conditions, gives us a clue: the flood of money emanating from the Fed is fueling stock prices. It is also fueling prices of all other financial assets.
The turnaround in silver is a more subtle story, shown in the chart as the reciprocal of the more usual gold/silver ratio. Silver had been ignored, classed solely as an industrial metal. Gold was seen by the financial community as the only metallic hedge against uncertainty in the financial system. That changed on 23 March when the gold/silver ratio peaked at 125 on the previous business day. It is now beginning to outperform gold with the gold/silver ratio currently down to 98. We might look back and pinpoint this time as marking the beginning of a return to some moneyness in silver.
The weeks before had seen the Fed ease monetary policy. On 3 March, the Fed cut its funds rate from 1 ½% to 1%. In the accompanying announcement the Fed said that the fundamentals of the economy remained strong, but the coronavirus posed evolving risks to the economy.
On 15 March, the Fed cut its funds rate again, this time to zero, but the statement now said the coronavirus had harmed communities and disrupted economic activity in many countries, including the US. On a twelve-month basis, overall price inflation and price increases for other than food and energy were running at below 2%. The Fed announced renewed quantitative easing of at least $500bn of Treasury purchases and $200bn of mortgage-backed securities “in the coming months”. It was “prepared to use its full range of tools to support the flow of credit to households and businesses and thereby promote its maximum employment and price stability goals.”
That day the Fed made two other announcements. The first detailed arrangements for the encouragement of credit expansion to support both consumers and businesses, including the reduction of reserve ratios for all banks to zero. The second concerned the reduction of costs in drawing down USD swap lines at the other major central banks. They were followed over the course of the week by a series of announcements facilitating the availability of credit.
Clearly, the Fed was engaging the ultimate in aggressive monetary policies. And taking a phrase from the last head of the ECB, the Fed had signaled it was prepared to do whatever it takes without limitation. But the response in the markets took a week to develop into an inflection point, a normal pause before a new direction is found.
By Pam Martens and Russ Martens: June 26, 2020 ~
Yesterday the Federal Reserve released its highly awaited stress tests on the biggest and most dangerous banks in America. The stress test results fill an 83-page document with dozens of charts showing what would happen to the banks under a hypothetical “severely adverse scenario.”
This scenario, unfortunately, was previously prepared and pales in comparison to the actual economic damage rendered by the COVID-19 pandemic. For example, the severely adverse scenario for this year’s stress tests imagined the U.S. unemployment rate climbing to a peak of 10 percent in the third quarter of 2021. The unemployment rate is currently 13.3 percent. But far more frightening, the Fed’s severely adverse scenario for GDP imagined a decline of “8½ percent from its pre-recession peak, reaching a trough in the third quarter of 2021.”
As of yesterday, June 25, the Atlanta Fed’s GDPNow estimate was for U.S. GDP to decline by a staggering 46.6 percent in the second quarter. In a feeble attempt to compensate for the fact that its “severely adverse scenario” now looks like a cake walk compared to the reality on the ground in the U.S., the Fed added what it calls a “sensitivity analysis.” That analysis assessed how the big banks would perform under three downside scenarios resulting from the coronavirus pandemic: a V-shaped recession; a slower, U-shaped recession; and a more severe W-shaped, double-dip recession.
The Fed summarized those three scenarios as follows: “Under the U- and W-shaped scenarios, most firms remain well capitalized, but several would approach minimum capital levels.”
The Fed, however, did not provide individual bank results for those scenarios. It provided individual bank results only for its previously announced criteria for the “severely adverse scenario” that imagined unemployment at 10 percent and a GDP decline of 8.5 percent. Under that scenario, the Fed projected $552 billion in losses in the aggregate for the 33 banks it reviewed, over nine quarters.
NOTICE & DISCLAIMER:
All #fhomoney content here and elsewhere is for educational and entertainment purposes only. I do not guarantee the accuracy of any information posted, linked to or shared. Pretty please (with sugar on top), D.Y.O.R. - DO YOUR OWN RESEARCH. As a nascent technology and emerging asset class, all things “crypto” are extremely RISKY and VOLATILE. I do not accept sponsors, advertising or compensation of any kind for what I share or discuss.
Nothing I post here or on any other channel is investment advice, a solicitation for any investment or legal advice. I am not your investment advisor or your attorney unless you have retained me pursuant to appropriate conversations and signed client agreements.